CTMeth - Convolutional-Transformer Methylation Analysis Framework
Introduction
CTMeth python library, which is the subject of dissertation titled"ANALIZA METYLACJI SEKWENCJI CPG W OPARCIU O UCZENIE MASZYNOWE I SIECI NEURONOWE" by Tomasz Falgowski, requires primary data processed from raw data from an idat file to β values in a comma-separated values (CSV) file. Analysis parameters are set for ease and reproducibility of research in a separate YAML file. This is a typical format used in configuration files and consistent with human-readable data-serialization language. The input data for the algorithm is a table containing β values. Rows represent individual CpG sequences, while columns correspond to samples. The mentioned YAML file contains information about dividing samples into a control group and an experimental group. A script using the described neural network classifies each CpG sequence separately for the control and experimental groups into one of three quantified labels (0, 1, 2). Labels correspond to three methylation states (hypermethylated, hypomethylated, undefined/partially methylated). The 'undefined' label is assigned to CpG sequences whose assessment regarding the status of methylation in a group cannot be clearly defined. In the next step, differently classified sequences are filtered out between the control and experimental groups according to one of two variants - CTMeth-hh and CTMeth-hhi. The first variant indicates CpG with different labels in the context of hypermethylation and hypomethylation, excluding those that were assessed as undefined (CTMeth-hh). The second variant, on the other hand, also includes sequences where a label 'undefined' was assigned for a given group, e.g., a hypermethylated control group and an undefined experimental group (CTMeth-hhi). The output data (results) contain selected CpG sequences, β values of individual samples, and the degree of confidence in the network, i.e., a parameter evaluating how well the data fit into a given category according to the developed algorithm. Data obtained in this way can be easily subjected to further analysis using other methods, such as those that constitute additional modules of the CTMeth library.
Installation and demo
Download the Archive: CTMeth.zip Begin by downloading the necessary archive file from the provided link.
Extract the Archive: Once the download is complete, unzip the archive to access the contained files.
Execute the Demo Script: Navigate to the extracted folder and execute the script
demo.py, which presents basic syntax and functionality of libraryCustomize Settings: Adjust the example_settings.yaml or use your own with own script according to your specific requirements. Detailed guidance on configuration and usage options is available below.
Requirements
Before using please make sure you have installed dependencies listed in requirements.txt. This code was tested with pytorch 1.13.1+cu117, windows 10. Should also work on ubuntu 20.04 LTS.
pip install -r requirements.txt
Functions
evaluate()
Evaluation
This is primary function designed to facilitate methylation analysis.
Requirements
This function requires the user to provide a path to the settings file, which contains all necessary parameters, including input and output data. For more information on settings, please refer to the documentation below.
Additional Options
Additionally, users have the flexibility to:
Utilize different neural network states
Adjust training settings (if applicable) for specific state configurations
Example result:
| cpg | Label A | Label B | A confidence | B confidence | Mean confidence | Confidence sum | GSM4056740 | GSM4056718 | GSM4056710 |
|---|---|---|---|---|---|---|---|---|---|
| cg00822007 | 1 | 0 | 8.100913047790527 | 1.3944158554077148 | 4.747664451599121 | 9.495328903198242 | 0.339802 | 0.06109 | 0.123447 |
| cg01944137 | 1 | 0 | 9.891323 | 7.772444725036621 | 8.831884384155273 | 17.663768768310547 | 0.034067 | 0.040849 | 0.062983 |
| cg01792749 | 1 | 0 | 5.139315128326416 | 2.089003562927246 | 3.614159345626831 | 7.228318691253662 | 0.092127 | 0.4002287579999999 | 0.046828 |
| cg01752041 | 1 | 0 | 7.571489334106445 | 8.632214546203613 | 8.101852416992188 | 16.203704833984375 | 0.4304835829999999 | 0.065578 | 0.322883 |
| cg00743717 | 0 | 1 | 1.903188 | 1.9817233085632324 | 1.942455530166626 | 3.884911060333252 | 0.761593 | 0.795436 | 0.452464 |
| cg02243276 | 1 | 0 | 9.824440956115723 | 8.682537078857422 | 9.253488540649414 | 18.506977081298828 | 0.033265 | 0.041007 | 0.4590376379999999 |
| cg01151584 | 1 | 0 | 6.436424732208252 | 7.284523963928223 | 6.860474586486816 | 13.720949172973633 | 0.05857 | 0.042534 | 0.047261 |
training()
Advanced Usage
This function is intended for experienced users who wish to utilize advanced features.
Retraining and Fine-Tuning
This tool can be used for retraining or fine-tuning neural networks. By modifying the training_settings.yaml file, users can adjust basic parameters of the training process.
Current Limitations At present, this function only supports training with synthetic generators. Future development is planned to expand its capabilities.
hiercluster()
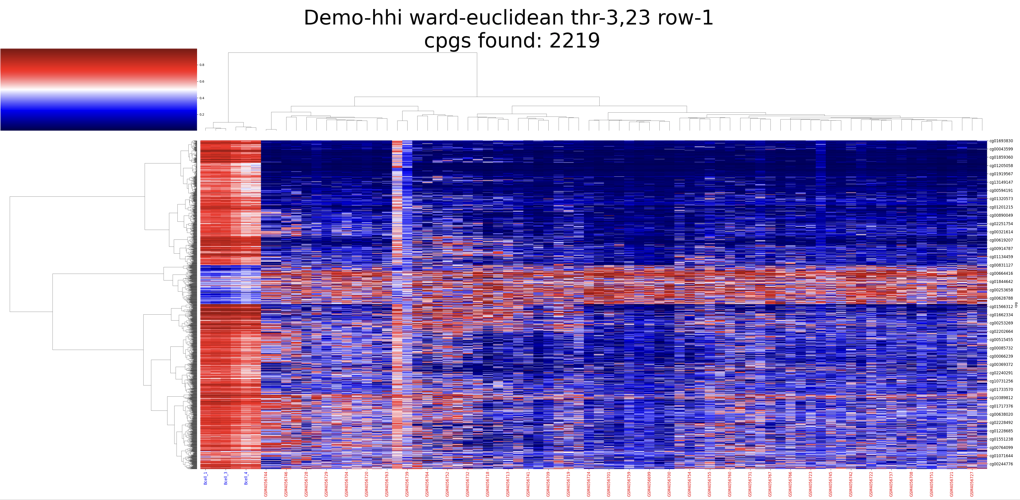
Hierarchical Clustering Module This module provides hierarchical clustering functionality.
Usage This module should be used after evaluation to further analyse and visualize the results.
Future Development Future development plans include expanding the capabilities of this module to accommodate custom data inputs.
Output The module generates hierarchical clustering heatmaps and calculates various scores, including:
Rand index
Mutual information-based scores
Homogeneity
Completeness
V-measure
Fowlkes-Mallow score
Example result:

| Method | Values |
|---|---|
| Real labels | [0 0 0 0 0 0 0 0 0 0 0 0 0 0 0 0 0 0 0 0 0 0 0 0 0 0 0 0 0 0 0 0 0 0 0 0 0 0 0 0 0 0 0 0 0 0 0 0 0 0 0 0 0 0 0 0 0 0 0 0 0 0 0 0 0 0 0 0 0 0 0 0 1 1 1 1 1 1] |
| Cluster labels | [1 1 1 1 1 1 1 1 1 1 1 1 1 1 1 1 1 1 1 1 1 1 1 1 1 1 1 1 1 1 1 1 1 1 1 1 1 1 1 1 1 1 1 1 1 1 1 1 1 1 1 1 1 1 1 1 1 1 1 1 1 1 1 1 1 1 1 1 1 1 1 1 0 0 0 0 0 0] |
| Cophentic correlation distance | 0.8965135190572778 |
| Rand index | 1 |
| Adjusted rand index | 1 |
| Mutual information score | 0.2711893730418441 |
| Adjusted MIS | 1 |
| Normalzed MIS | 1 |
| Homogenity | 1 |
| Completness | 1 |
| V-measure | 1 |
| Fowlkes_mallow_score | 1 |
pca2d()
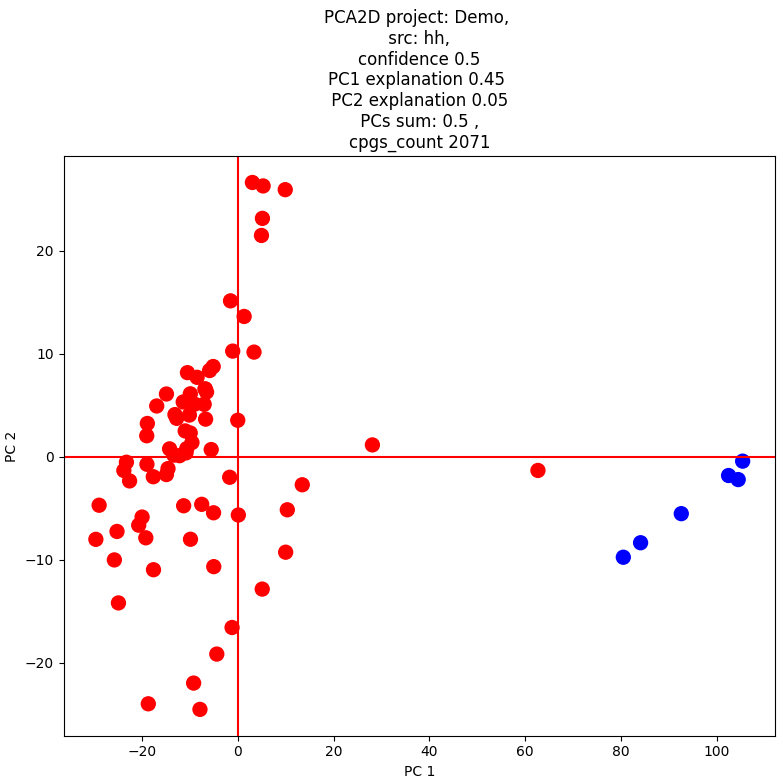
2D Principal Component Analysis (PCA) Module This module performs dimensionality reduction using 2D Principal Component Analysis.
Output Options The module allows users to either display the results as a plot or generate an image file for further analysis and visualization.
Usage This module is intended for use after evaluation, allowing users to gain deeper insights into their data.
Future Development Future development plans include expanding the capabilities of this module to accommodate custom data inputs.
Example result:

pca3d ()
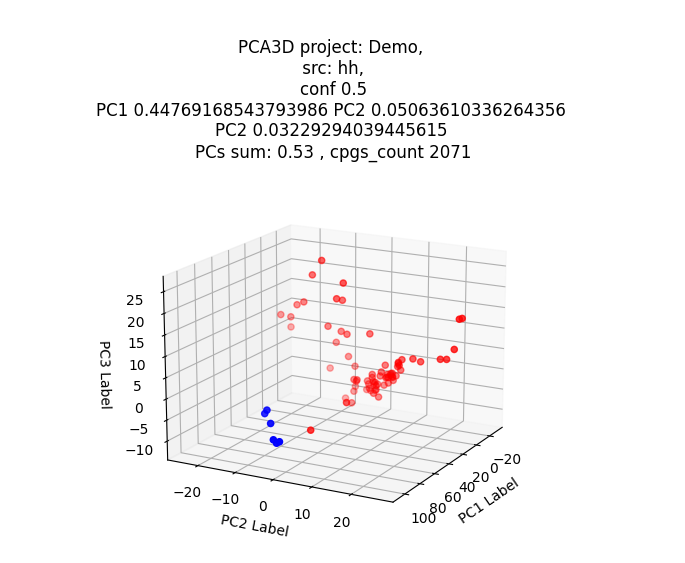
3D Principal Component Analysis (PCA) Module This module performs dimensionality reduction using 3D Principal Component Analysis.
Output Options The module allows users to either display the results as a plot or generate an image file for further analysis and visualization.
Usage This module is intended for use after evaluation, allowing users to gain deeper insights into their data by visualizing high-dimensional relationships in 3D space.
Future Development Future development plans include expanding the capabilities of this module to accommodate custom data inputs, enabling users to tailor the analysis to their specific needs.
Example result:

heatmap()
Here is a rewritten version of the text in a professional tone:
Simple Heatmap Module This module generates a basic heatmap visualization.
Usage The heatmap module is intended for use after evaluation, allowing users to visualize and explore relationships between variables.
Future Development Future development plans include expanding the capabilities of this module to accommodate custom data inputs, enabling users to tailor the analysis to their specific needs.
download_databases()
Required Datasets To utilize tool, you will need to download the following datasets:
Biogrid Dataset: This dataset provides essential information for y analysis.
Methylation Annotation Dataset: This dataset contains annotations necessary for methylation analysis.
Downloading Required Databases
The download_databases() function is available to facilitate the downloading of these required databases, ensuring that you have the necessary data for a successful analysis.
yaml_generator ()
YAML Editor GUI A simple graphical user interface (GUI) is available for editing YAML files. This tool allows users to modify and customize their settings without requiring extensive programming knowledge.
Please note that this GUI is designed specifically for editing YAML files. Widgets are generated automatically, when loaded new YAML file, so user can use it with independently. However this functionality is under development.
paths (cpg-gene-gene-cpg module)
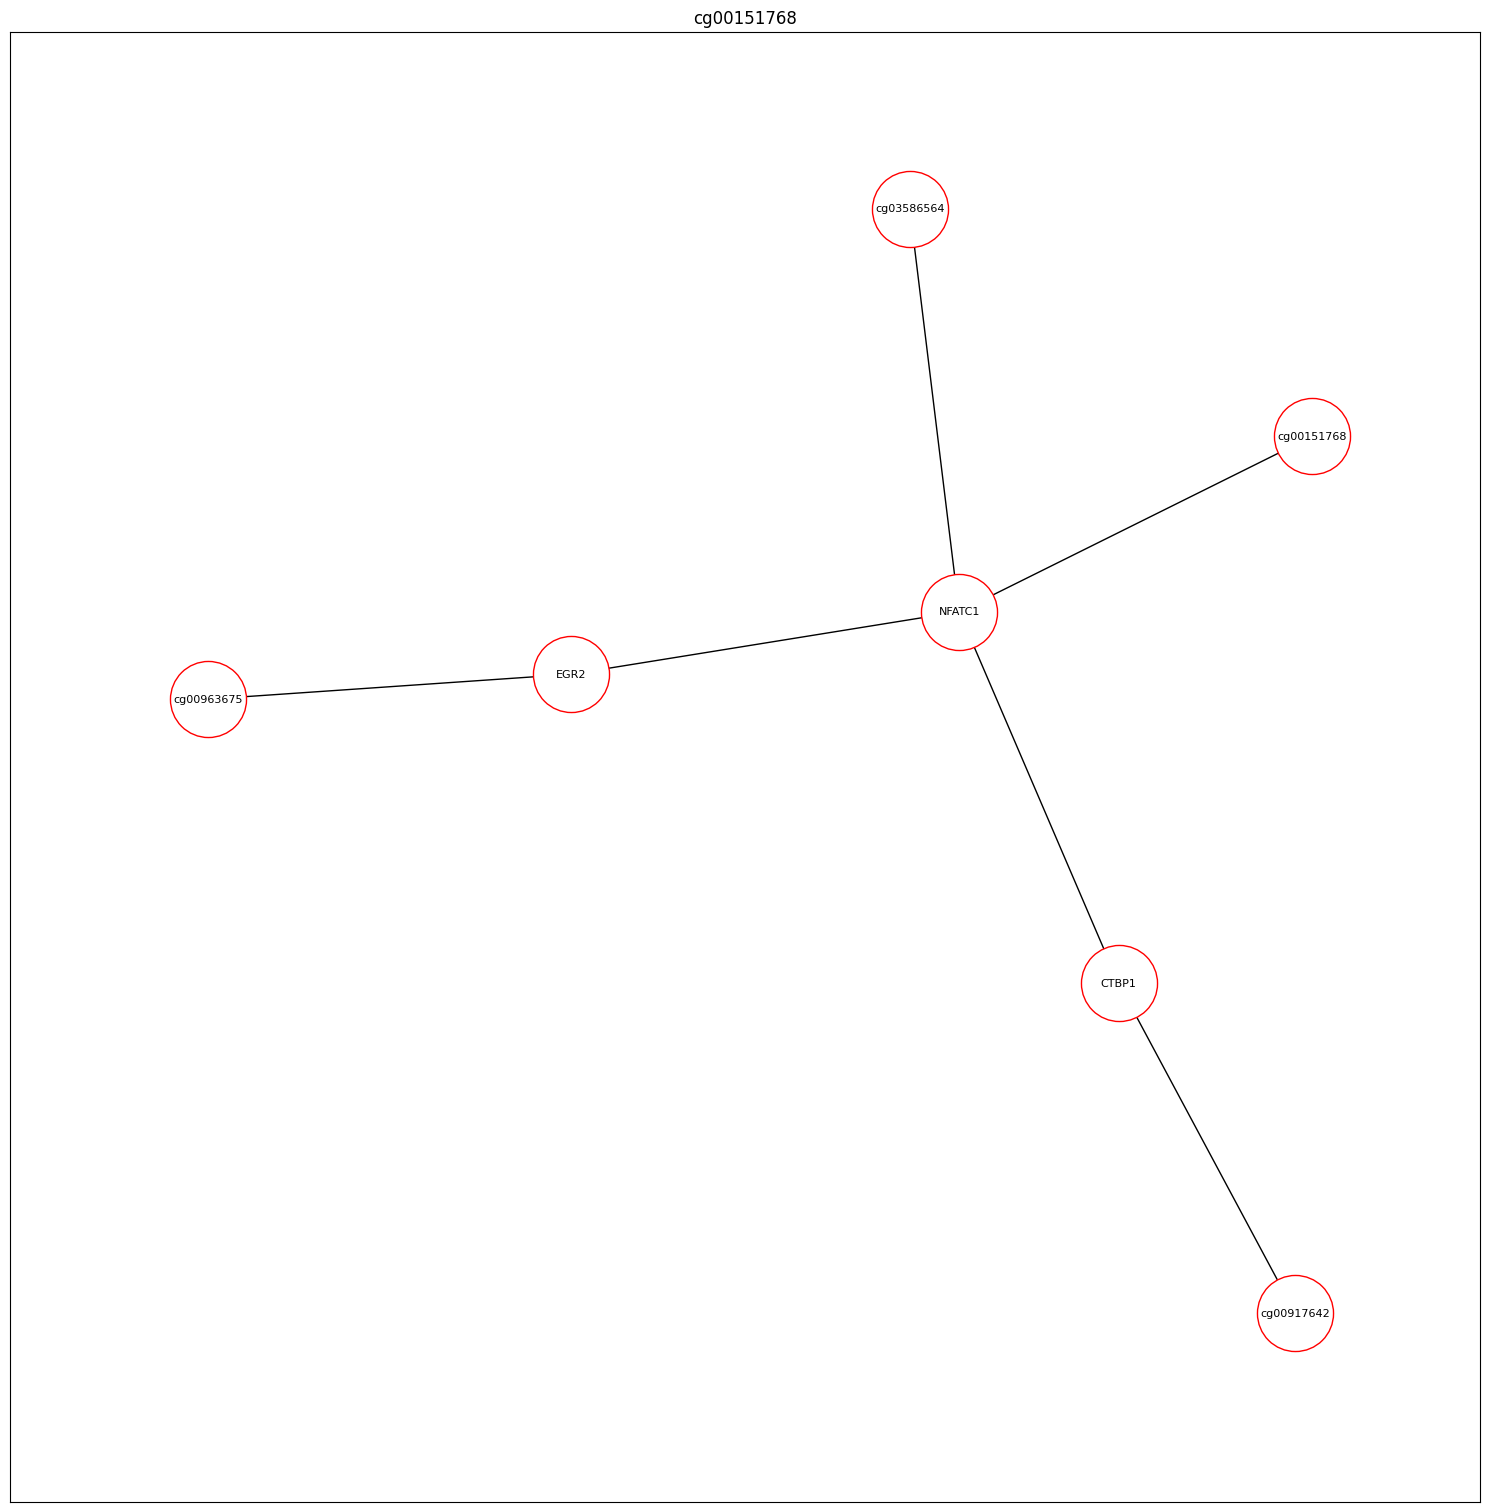
Module for Analyzing CGP Interactions This module performs analysis based on the connections between CpGs, which are annotated to specific genes and their interactions.
Example For instance, if two CpGs (Cpg1 and Cpg2) are identified, they may be annotated to genes Gene1 and Gene2, respectively. If these genes interact with each other, the module can identify the pathways involved in this interaction.
CpG1 → Annotated Gene 1 → Annotated Gene 2 ← CpG2
This module provides valuable insights into the complex relationships between CpGs, genes, and their interactions, enabling a deeper understanding of epigenetic regulation and its impact on biological processes.
Example result:

YAML Settings Description
The following YAML settings are used to configure the project and its output. These settings enable users to customize their project and output files according to their specific needs.
project_name:
your project name. it will be used for titles on plots etc.project_path: Path to the project folder, where all output data from additional modules will be stored.
input_data: Path to the input data file. Data you want to analyze
output_path_full: Path to the output file containing full result, both differentially and non-differentialy methylated CpGs, with all labels and confidence levels.
output_path_only_hyper_hypo: Path to the output file containing results for differentially methylated CpGs in the context of hypermethylation and hypomethylation.
output_path_hyper_hypo_indeter: Path to the output file containing results for differentially methylated CpGs in the context of hypermethylation, hypomethylation, and indeterminate label.
output_path_indeter_indeter: Path to the output file containing results for non-differentially methylated CpGs, labeled as indeterminate for both control and study groups.
no_cuda:
False(default), indicating whether to use CPU or GPU for computation. If set toTrue, CPU will be used.gpu_id:
0(default), specifying the device ID when using CUDA. This allows users to select which GPU should be used.group_divide:
72, n samples defined as group A(e.g. control group), subsequent columns will be treated as group B.separator:
,, indicating the separator used in the input dataset.
Heatmap Settings
heatmap_src:
null- Evaluation output source for heatmap (hh, hhi, ii or full). If an array (e.g.[hh, hhi, ii]) is provided, multiple heatmaps will be generated. Ifnull, both hh and hhi heatmaps will be produced.heatmap_sep_src:
,- Source file separator. Future versions of the heatmap module may allow for customization of this setting.heatmap_save:
true- Save heatmap after generating.heatmap_show:
false- Show heatmap after generating.heatmap_confidence_thresholds:
0- Crop heatmap based on confidence level. If an array (e.g.[0, 1, 2]) is provided, multiple heatmaps will be generated.heatmap_sep_samples:
false- Heatmap separate samples with a line.heatmap_cmap:
seismic- Heatmap color map.heatmap_full_output_path:
null- Other than based on project path heatmap output file.heatmap_output_folder:
null- Other than project path heatmap output folder.heatmap_width:
45- Heatmap width.heatmap_height:
25- Heatmap height.heatmap_group_divide:
trueorfalse- Draw divide line between control and study group.heatmap_group_divide_width:
8- Width of the line described above.heatmap_group_divide_color: Color of the line described above.
heatmap_title_fontsize:
64- Heatmap title font size.
Clustering Settings
clustermap: Hierarchical clustering settings.
cluster_src:
hhi- Clustering source.Example: if hh is submited output_path_only_hyper_hypo will be used.cluster_sep_src:
,- Clustering source separator.cluster_save:
'True'- Save clustering image.cluster_show:
'False'- Show clustering image.cluster_confidence_thresholds
: Crop data based on confidence level. Ifnull`, clustering will be based on percentile 0, 50, 75, 95.cluster_sep_samples:
false- Separate samples with a line.cluster_cmap:
seismic- Clustering colormap.cluster_full_output_path:
null- Clustering full output file path if needed to save elsewhere than project path.cluster_output_folder:
null- Clustering full output folder path if needed to save elsewhere than project path.cluster_width:
45- Clustering image width.cluster_height:
22- Clustering image height.cluster_title_fontsize
:64` - Clustering title font size.cluster_row:
true- Should clustering be made also for rows (CpGs).cluster_method:
ward- Clustering method.
PCA 2D Settings
pca2d_show:
false- Display PCA 2D results.pca2d_save:
true- Save PCA 2D results.pca2d_src:
hh- Source of data for PCA 2D analysis. Example: if hh is submitted output_path_only_hyper_hypo will be used.pca2d_src_sep:
,- Separator used in the source file.pca2d_confidence_thresholds:
null, if null, input data will be cropped according to confidence percentiles (0%, 50%, 75%, 95%).
PCA 3D Settings
pca3d_src:
hh- Source of data for PCA 3D analysis. Example: if hh is submited output_path_only_hyper_hypo will be used.pca3d_src_sep:
,- Separator used in the source file.pca3d_confidence_thresholds:
null, if null, input data will be cropped according to confidence percentiles (0%, 50%, 75%, 95%).pca3d_show:
false- Display PCA 3D results.pca3d_save:
true- Save PCA 3D results.
Paths - cpg-gene-gene-cpg module settings
paths_src:
hh- Source of data for paths analysis.paths_src_sep:
,- Separator used in the source file.paths_depth:
3- Depth of paths analysis.paths_confidence_thresholds:
null, if null, input data will be cropped according to confidence percentiles (0%, 50%, 75%, 95%).paths_show_if_true:
false- Display paths results if true. It will show every path it find.paths_show_if: `` - Condition for displaying paths results.
paths_save:
true- Save paths results.
Methylation Annotation Dataset Settings
annotation_dataset_path:
humanmethylation450_15017482_v1-2.csv- Path to the annotation dataset file.annotation_dataset_skiprows:
7, used to skip rows containing description of data, not actual data.annotation_dataset_sep:
,- Separator used in the annotation dataset file.annotation_dataset_USC_RefGene_Name_colname:
UCSC_RefGene_Name- Column name for USC RefGene Name.
Biogrid Dataset Settings
biogrid_dataset_path:
BIOGRID-ORGANISM-Homo_sapiens-4.4.205.tab.txt- Path to the biogrid dataset file.biogrid_dataset_skiprows:
35, used to skip rows containing description of data, not actual data.biogrid_dataset_sep:
\t- Separator used in the biogrid dataset file.biogrid_dataset_index_col:
2- Index column for the biogrid dataset.
Roadmap
integrating idat files analysis
adding proper GUI
further tools development and making script as automated as possible
Files and folders structure
Software Components CTMeth methylation analysis framework consists of several software components, each with its own specific functions.
workflow_control.py: This script contains methods and calls for methods used to manage the workflow of methylation analysis framework.
CTMeth_neural.py: This script contains the neural network model for CTMeth, a key component in framework.
CTMeth.pth: This is the default state for the CTMeth neural network model.
hierclusterer.py: This script contains the hierarchical clustering module, which enables users to analyse and visualize their data.
heatmaper.py: This script contains a simple heatmapping module, allowing users to create visualizations of their data.
apca3d.py and apca2d.py: These scripts contain PCA (Principal Component Analysis) modules for 3D and 2D dimensionality reduction, respectively.
yaml_operator.py: This script provides basic tools for manipulating YAML files, which are used to store settings and configurations in framework.
read_write_csv.py: This script contains basic reading and writing tools for CSV files, which are used internally within framework.
paths_generator.py: This script contains the cpg-gene-gene-cpg module, which enables users to analyse the relationships between CpGs, genes, and their interactions.
distribution_generator.py, and SynMethDatasetLoader.py: These scripts are used to generate synthetic training data for neural network model.
training.settings.yaml: This file contains draft training settings for framework.
training_module.py: This module is responsible for training and retraining neural network model.
These software components work together to provide a comprehensive methylation analysis framework, enabling users to analyse and visualize their data with ease.
General view of code interaction
##
License:
MIT License
Copyright (c) 2023 Tomasz Falgowski
Permission is hereby granted, free of charge, to any person obtaining a copy of this software and associated documentation files (the "Software"), to deal in the Software without restriction, including without limitation the rights to use, copy, modify, merge, publish, distribute, sublicense, and/or sell copies of the Software, and to permit persons to whom the Software is furnished to do so, subject to the following conditions:
The above copyright notice and this permission notice shall be included in all copies or substantial portions of the Software.
THE SOFTWARE IS PROVIDED "AS IS", WITHOUT WARRANTY OF ANY KIND, EXPRESS OR IMPLIED, INCLUDING BUT NOT LIMITED TO THE WARRANTIES OF MERCHANTABILITY, FITNESS FOR A PARTICULAR PURPOSE AND NONINFRINGEMENT. IN NO EVENT SHALL THE AUTHORS OR COPYRIGHT HOLDERS BE LIABLE FOR ANY CLAIM, DAMAGES OR OTHER LIABILITY, WHETHER IN AN ACTION OF CONTRACT, TORT OR OTHERWISE, ARISING FROM, OUT OF OR IN CONNECTION WITH THE SOFTWARE OR THE USE OR OTHER DEALINGS IN THE SOFTWARE.
Results mentioned in dissertation titled "ANALIZA METYLACJI SEKWENCJI CPG W OPARCIU O UCZENIE MASZYNOWE I SIECI NEURONOWE"
Here are links to results mentioned in dissertation titled "ANALIZA METYLACJI SEKWENCJI CPG W OPARCIU O UCZENIE MASZYNOWE I SIECI NEURONOWE"